
This function is a support tool designed for performance analysis. It tracks all queries sent by the Performer Suite and provides the basis for identifying and analyzing performance issues.
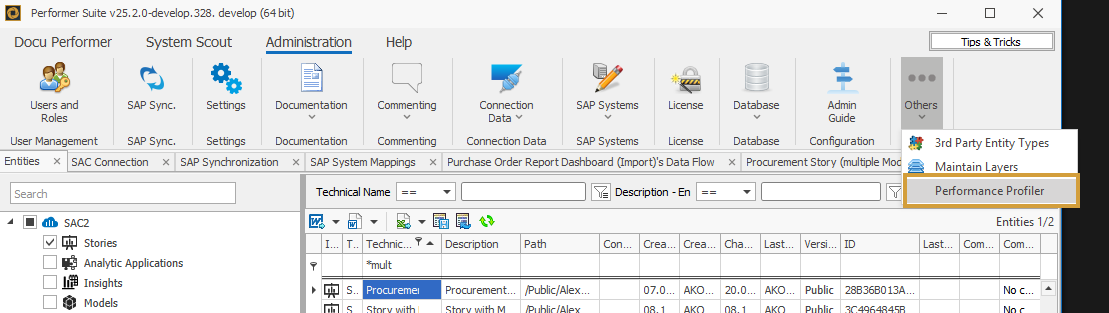
The Performance Profiler can be found under Administration > Others.
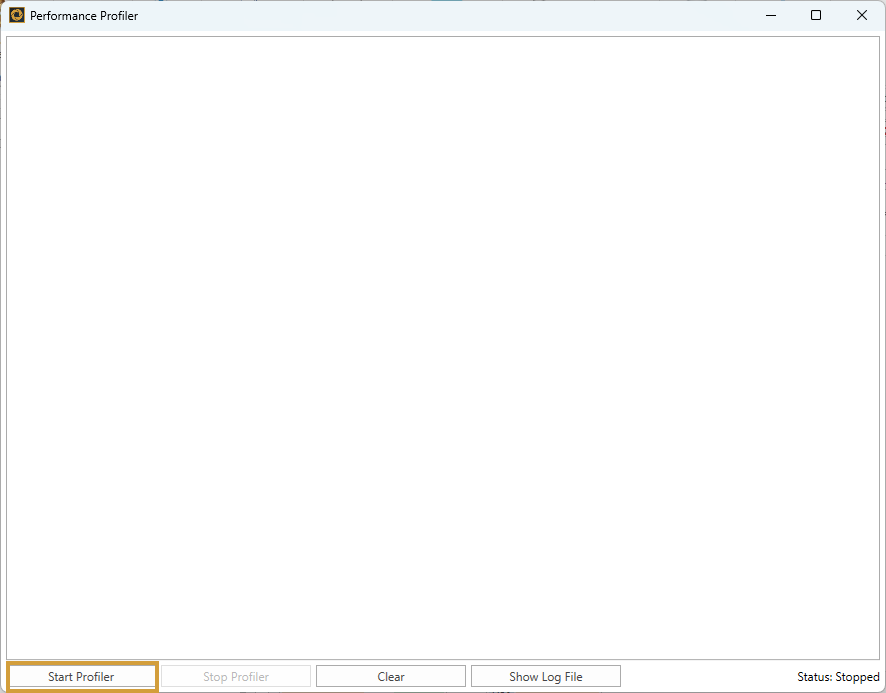
The trace can then be activated by selecting “Start Profiler”:
When this mode is enabled, all queries executed by the Performer Suite are tracked along with their execution duration and written to a separate log file.
Therefore, when using this tool for analysis purposes, it is recommended to execute only the specific action whose performance you want to track.
Afterwards, the Performance Profiler can be stopped again via “Stop Profiler”
In the Performance Profiler window, you can already see which activities have been recorded. These entries can be removed by selecting “Clear”.
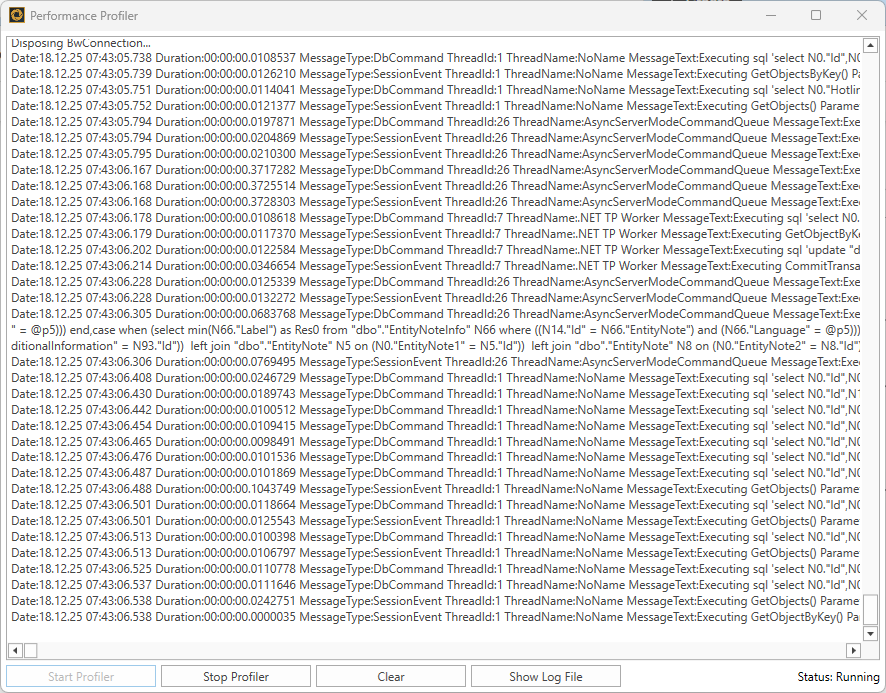
This information is stored in a log file, which you can also access via the Performance Profiler via “Show Log File”.
💡 This log file is primarily required by our support team in order to provide targeted assistance with performance issues!